
Scenarios 36 - 39
License

If you want to use the dataset or scripts on this page, please use the link below to generate the final list of papers that need to be cited.
Overview
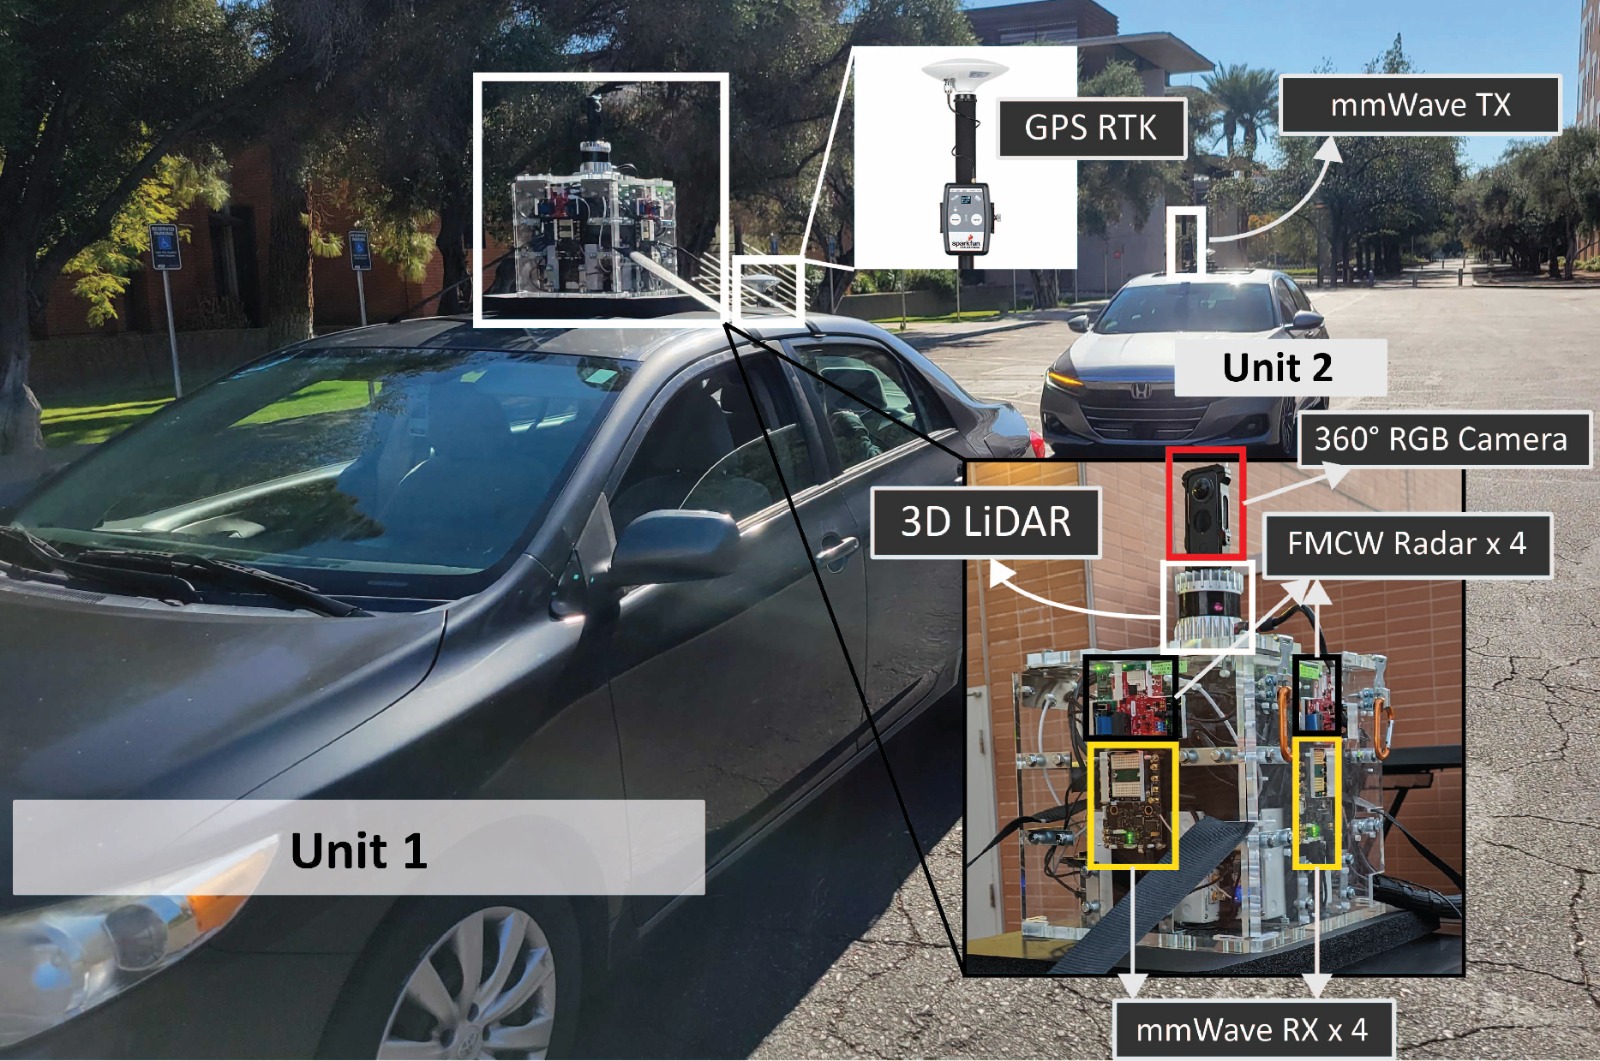
Illustration of the DeepSense V2V testbed utilized for data collection. Please refer to the detailed description of the testbed presented here.
Scenarios 36 – 39 are collected in an outdoor wireless environment and are explicitly designed to study high-frequency V2V communication in the real world. The DeepSense testbed 6 is utilized in the data collection. It consists of two units: (i) Unit 1, mobile receiver (vehicle) equipped with four 60-GHz mmWave Phased arrays facing four different directions, i.e., front, back, left, right. Each phased array adopts a uniform linear array (ULA) with 16 elements and utilizes an over-sampled pre-defined codebook of 64 beam directions to receive the transmitted signal. It is further equipped with a 360-degree RGB camera, four mmWave single-chip FMCW radars (operating between 76-81GHz), one 3D LiDAR with 32 vertical and 1024 azimuth channels, and one GPS RTK kit. (ii) Unit 2, a mobile transmitter equipped with a 60-GHz quasi-omni antenna always oriented towards the receiver unit and a GPS receiver to capture the real-time position information. Please refer to the detailed description of the testbed presented here.
The DeepSense V2V dataset consists of four different scenarios, namely Scenarios 36-39, each capturing different driving conditions and characteristics. Scenarios 36 and 37 are collected in long drives between cities, targeting long travels, and are referred to as inter-city scenarios. Scenarios 38 and 39 are predominantly focused on emulating short urban commutes, capturing data primarily within city boundaries. Hence, we classify Scenarios 38 and 39 as urban scenarios. The distinction between these sets is supported by the variations in traveled distances and average speeds of the vehicles. Scenarios 36 and 37 involve traveling long distances at relatively high average speeds, while Scenarios 38 and 39 cover shorter distances at lower speeds due to speed limits imposed within cities.
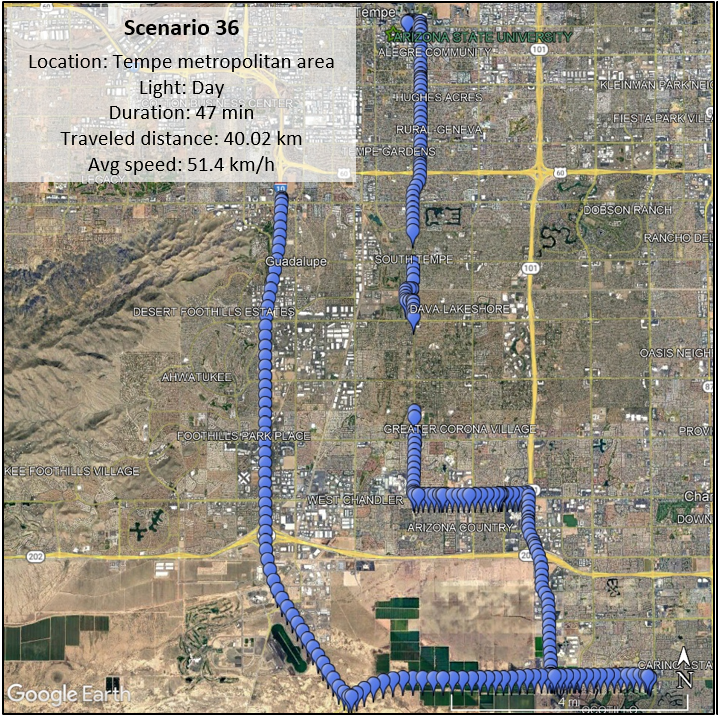
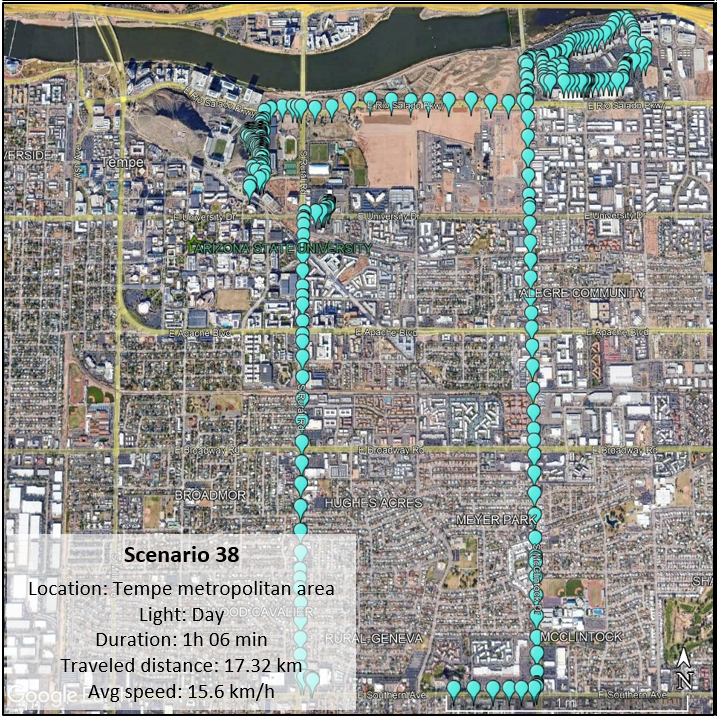
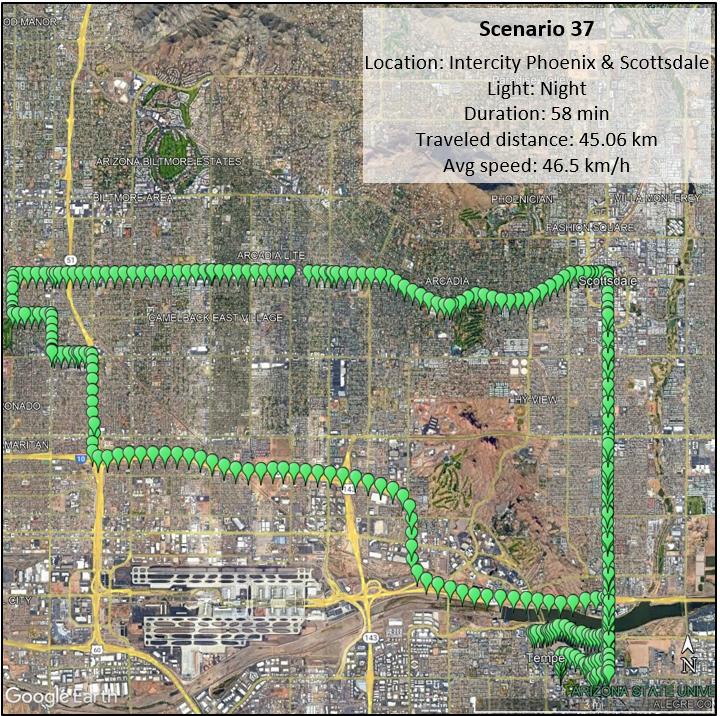
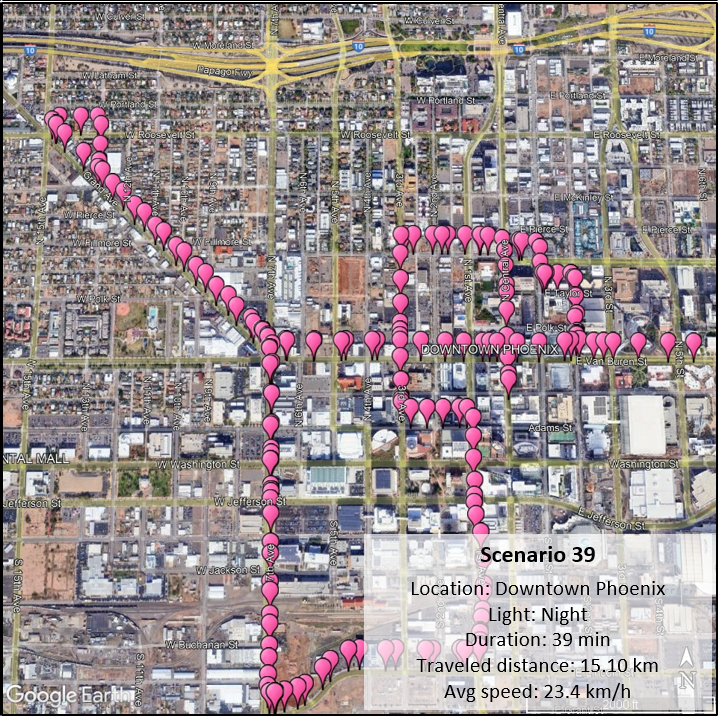
The figure presents the satellite images with the locations of each scenario. It further includes several macro statistics of the data collection providing contextual and objective information derived mainly from the GPS sensors. More information above the data collected follows below.
Collected Data
Number of Data Collection Units: 2 (using DeepSense Testbed #6)
Total Number of Data Samples: 112200
Scenario-wise Number of Samples:
Scenario 36: 24800 || Scenario 37: 31000 || Scenario 38: 36000 || Scenario 39: 20400
Data Modalities: 360° RGB images, 4 x 64-dimensional received power vector, GPS locations, 3D LiDAR point-cloud, and 4 x FMCW radar signal
Sensors at Unit 1: (Mobile Receiver)
- Wireless Sensor [Phased Array]: Four 60-GHz mmWave Phased arrays facing four different directions, i.e., front, back, left, and right. Each phased array adopts a uniform linear array (ULA) with 16 elements and utilizes an over-sampled pre-defined codebook of 64 beam directions to receive the transmitted signal
- Visual Sensor [Camera]: The main visual perception element in the testbed is a 360-degree camera. It is used to export four 90º views and two 180º views around the car, effectively covering all angles and emulating the existence of multiple cameras around the vehicle. This camera has the capability to capture 360-degree videos at a resolution of 5.7 K and a frame rate of 30 FPS
- Position Sensor [GPS Receiver]: To capture precise real-time locations for the unit 1 vehicle, a GPS-RTK receiver is employed. This receiver utilizes the L1 and L2 bands, enabling enhanced accuracy. As per the manufacturer’s specifications and the device’s horizontal dilution measures, the horizontal accuracies consistently remain within one meter of the true position
- 3D LiDAR Sensor: The LiDAR sensor in the testbed offers range and angle data for objects within its field of view. With a maximum motor spin frequency of 20Hz, it generates a 32 thousand-point 3D point cloud. The LiDAR has a maximum range capability of 200 meters, allowing for comprehensive scanning and perception of the environment
- FMCW radar: Similar to the phased arrays, the testbed incorporates four Frequency Modulated Continuous Wave (FMCW) radar sensors, each positioned to cover a different direction, ensuring complete 360-degree coverage. The FMCW radar samples consist of a 3D complex radar frame comprising the number of receive (RX) antennas, the number of samples per chirp, and the number of chirps per frame [(# of RX antennas) x (# of samples per chirp) x (# of chirps per frame)]
Sensors at Unit 2: (Mobile Transmitter)
- Wireless Sensor [Phased Array]: A 60 GHz mmWave transmitter. The transmitter (Unit 2) constantly transmits using one antenna element of the phased array to realize omnidirectional transmission
- Position Sensor [GPS Receiver]: A GPS-RTK receiver for capturing accurate real-time locations for the mobile unit 2
| Testbed | 6 |
|---|---|
| Instances | Scenario 36: 24800 || Scenario 37: 31000 || Scenario 38: 36000 || Scenario 39: 20400 |
| Number of Units | 2 |
| Data Modalities | 360° RGB images, 4 x 64-dimensional received power vector, GPS locations, 3D LiDAR point-cloud, and 4 x FMCW radar signal |
| Unit1 | |
| Type | Mobile |
| Hardware Elements | 360-degree RGB camera, 4 x mmWave phased array receiver, GPS receiver, 3D LiDAR, 4 x FMCW radar |
| Data Modalities | 360-degree RGB images, 4 x 64-dimensional received power vector, GPS locations, LiDAR point cloud, radar data |
| Unit2 | |
| Type | Mobile |
| Hardware Elements | mmWave omni-directional transmitter, GPS receiver |
| Data Modalities | GPS locations |
Data Processing
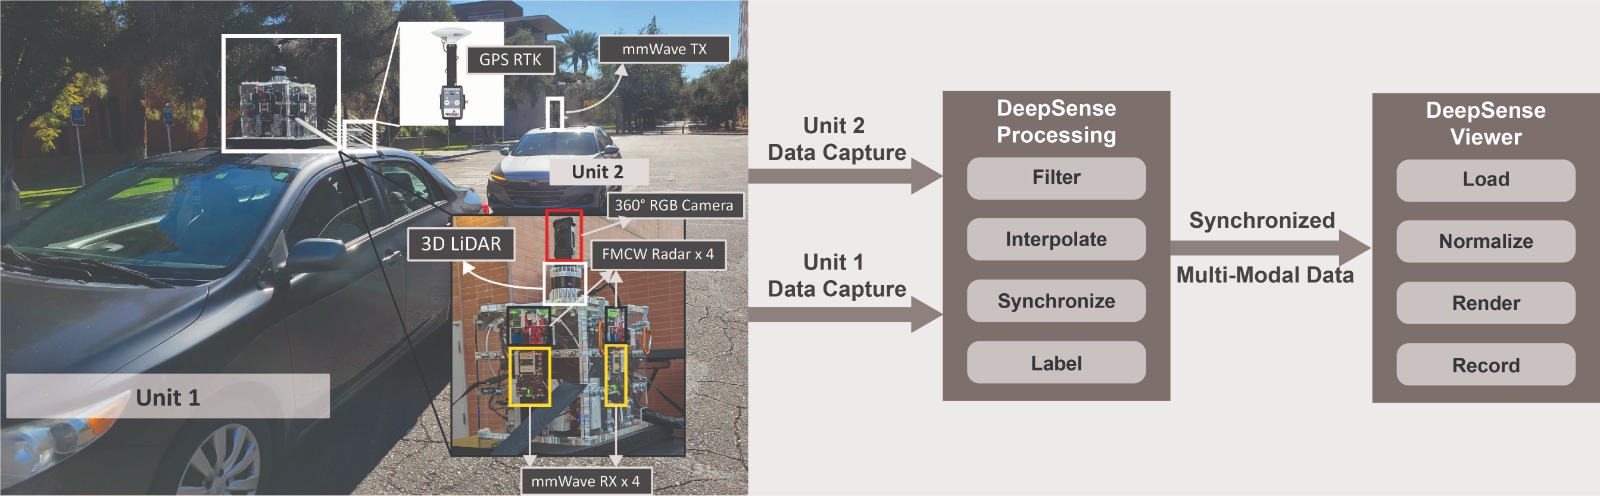
Illustration of the DeepSense V2V testbed utilized for data collection. Detailed description of the testbed presented here.
The DeepSense scenario creation pipeline involves two important stages: data processing and data visualization.
Data Processing: In the data processing stage, the collected sensor data is transformed into a common format that can be easily ingested and synchronized. This stage consists of two phases. Phase 1 focuses on converting data from different sensors into timestamped samples and organizing them in clear CSVs. It also involves interpolating GPS data to ensure proper synchronization. Phase 2 filters, organizes, and synchronizes the extracted data into a processed DeepSense scenario. This phase includes tasks such as data synchronization, filtering, sequencing, labeling, and data compression.
Data synchronization aligns samples from different sensors to a uniform sample rate based on timestamp proximity. Filtering involves rejecting samples based on specific criteria, including acquisition errors, non-coexistence of sensor sampling, and sequence filtering. Sequencing groups continuous samples together, ensuring a maximum 0.1-second gap between samples. Data labels provide additional contextual information, which can be derived from sensors or manually added. Data compression is performed to reduce file size, improve distribution efficiency, and allow selective downloading of specific modalities.
Data Visualization: The data visualization stage plays a crucial role in interpreting and understanding the dataset. It leverages the DeepSense Viewer library, providing a user interface (UI) for data visualization. Scenario videos are rendered, displaying all processed data synchronized over time. These videos facilitate navigation through the dataset, identification of relevant samples, and observation of propagation phenomena and sensor conditions.
Scenario Data Visualization
Download
Please login to download the DeepSense datasets
How to Access Scenario Data?
Step 1. Download Scenario Data
1.1 – Click one of the Download buttons above to access the download page of each scenario.
1.2 – Select the modalities of interest and download (individually!) all zip files of the modality. E.g., if interested in Scenario 36 GPS and RGB images with 180º FoV, download the following files:
- scenario36.csv;
- scenario36_gps.zip001;
- scenario36_rgb180.zip.001, scenario36_rgb180.zip.002, (…)003, (…)004, and scenario36_rgb180.zip.005.
Step 2. Extract modality data
2.1 – Install the 7Zip utility (download here) to be able to extract ZIP files split in parts
2.2 – Select all zip files downloaded and select “Extract here”.
(Explanation: This will extract the scenario folder from inside the zip files. Each zip file has a scenario folder with the same name, but different modality data inside. As a results, the scenario folders from the zips of different modalities will overlap and merge automatically, leading to a single scenario folder with the right structure. )
Note: If a problem during the extraction, please ensure the files downloaded have the right sizes listed in this table.
2.3 – Move the CSV file inside the scenario folder extracted from the ZIPs.
Scenario X folder consists of three data sub-folders:
- unit1: Includes the data captured by unit 1
- unit2: Includes the data captured by unit 2
- resources: Includes scenario-specific annotations, data labels, and other additional information. For more details, refer to the resources section below.

Besides data, the scenario folder includes two useful resources to provide context and facilitate the use of the data:
- “scenario X.csv” file: contains all sample indices, timestamps, sensor-specific metadata, and paths to each modality. Each sampling interval leads to a new row in this CSV, and it can be used to load all scenario data
- “scenarioX.p” and “scenarioX.mat”: dictionaries for Python and Matlab that contain all the information present in the CSV file. The advantage of these structures compared with the CSV is that data such as the GPS positions or received power vectors are already pre-loaded, allowing quicker and more convenient access to the data.
Watch a video explaining the steps of accessing the dataset
Resources
What are the Additional Resources?
The additional resources in this scenario consist of satellite images. One clear example of these images is presented in the Scenario videos in the “Data Visualization” section of this page. The satellite images are the satellite background that changes as the GPS positions change. These images provide context in the immediate surroundings of vehicles and allow for informative GPS plots. The paths to the satellite images resources are listed in the CSV and in the pre-loaded dictionaries with the column/keyword name of satellite_img.
Additional Information: Explanation of Data in CSV
We further provide additional information for each sample present in the scenario dataset. The information provided here gives respect to the data listed in scenarioX.csv. Here we explain what each column means.
General information:
- abs_index: Represents the sample absolute index. This is the sample index that is displayed in the video. This index remains unchanged from the sample collection all the way to the processed scenario. The advantage is a perfect backtrace of information across processing phases. Moreover, if problems with the data exist, mentioning this sample index allows easier interactions with the DeepSense team.
- Timestamp: This column represents the time of data capture in “hr-mins-secs.us” format with respect to the current timezone. It not only tells the time of the data collection but also tells the time difference between sample captures.
- seq_index: The index of a sequence. Samples have different sequence indices for two reasons. The main reason is to separate continuous sampling intervals. Samples with the same index have been collected at precisely the same sampling rate (10 Hz in this case). As such, when the sequence index changes, it is because some circumstances of the data collection lead to a sample loss or similar, thus disrupting the continuity. However, it is possible that adjacent samples with different sequence indices have a 100 ms interval between them, thus actually respecting the continuity. In this case, the second reason for changing sequences applies. The second reason for changing sequences is to create 20-second chunks of data that can be separated for training and testing purposes. No sequence is larger than 20 s (200 samples) because of this reason. If the last sample of a sequence and the first sample of the next have consecutive absolute indices (abs_index column), then the sequence changed because of the 20 s rule, not because of a break in continuity.
Sensor-specific information:
Sensors can be gps1, pwr2, lidar1, radar3, etc. Sensors are associated with units. unit1_gps1 refers to the first GPS of unit 1. unit2_gps1 refers to the first GPS of unit 2. In these scenarios, only radar and power have more than one sensor per unit. It is important to recognize that for the power and radar sensors, the order (1, 2, 3, 4) is not arbitrary – it represents the directions they face. pwr1 regards the received power from the phased array in the front of the car. pwr2, pwr3, and pwr4 are from right, back, and left (clockwise direction), similarly with radar 1 to 4. Therefore, unit1_pwr1 will have information about the phased array in the front, and unit1_radar4 will have the raw radar samples from the radar pointing to the left. Sensors may additionally have labels. Labels are metadata acquired from that sensor. In these scenarios, only two sensors have metadata, and the labels are as follows:
- gps1_lat / gps1_lon / gps1_altitude: Latitude, longitude, and altitude.
- gps1_pdop / gps1_hdop / gps1_vdop: Position, horizontal and vertical, dilutions of precision. Measures of GPS confidence.
- pwr1_best-beam: a value between 0 and 63 representing the index of the beam that received the maximum power in the current time instant.
- pwr1_max-pwr / pwr1_min-pwr: values of the baseband received powers for a receive power vector of a certain array. These are the maximum and minimum powers computed in the baseband.
Unit-specific information:
Information regarding a certain unit. unit1 refers to the receiver, unit2 to the transmitter. These scenarios have mostly sensor data associated with each unit, except the unit1 which has one label computed to facilitate the use of the dataset:
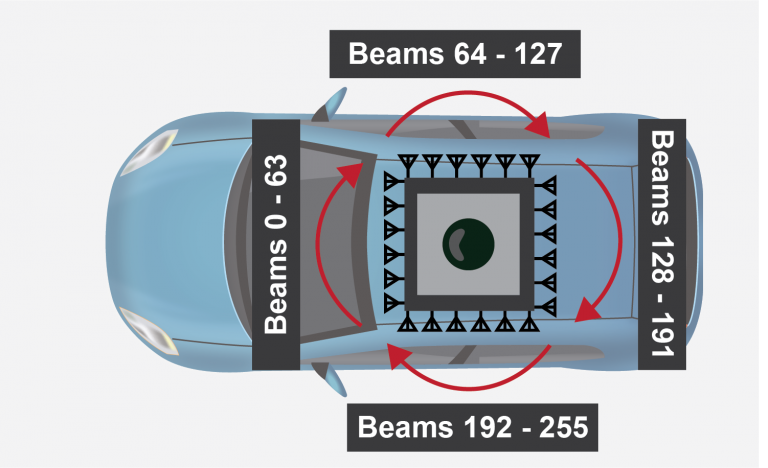
- unit1_overall-beam: a value between 0 and 255 indicating the best beam across all phased arrays. Beam 0 corresponds to the first beam of the first array (unit1_pwr1) and beam 255 corresponds to the last beam of the last phased array (unit1_pwr4). Note further that the phased arrays sweep 64 beams in azimuth and the first beam is the leftmost beam. As such, one can imagine beam 0 pointing to 45º to the left of the direction the vehicle is moving, beam 63 pointing 45º to the right of this direction, and the remaining beams pseudo-uniformly covering the angular domain clockwise. Please refer to the image below.
An example table comprising of the first 10 rows of Scenario 36 is shown below.
| abs_index 2674 | timestamp 11-46-31.214536 | seq_index 1 | unit1_gps1 unit1/gps1/gps_8869_11-46-31.233334.txt | unit1_gps1_lat 33.42170563 | unit1_gps1_lon -111.9301714 | unit1_gps1_altitude 354.8673333 | unit1_gps1_hdop 0.5 | unit1_gps1_pdop 1.07 | unit1_gps1_vdop 0.94 | unit1_rgb1 unit1/rgb1/frame_11-46-31.205818.jpg | unit1_rgb2 unit1/rgb2/frame_11-46-31.205818.jpg | unit1_rgb3 unit1/rgb3/frame_11-46-31.205818.jpg | unit1_rgb4 unit1/rgb4/frame_11-46-31.205818.jpg | unit1_rgb5 unit1/rgb5/frame_11-46-31.205818.jpg | unit1_rgb6 unit1/rgb6/frame_11-46-31.205818.jpg | unit1_pwr1 unit1/pwr1/pwr_11-46-30.559536.txt | unit1_pwr1_best-beam 14 | unit1_pwr1_max-pwr 0.00035276 | unit1_pwr1_min-pwr 0.000127547 | unit1_pwr2 unit1/pwr2/pwr_11-46-30.559536.txt | unit1_pwr2_best-beam 43 | unit1_pwr2_max-pwr 0.000467878 | unit1_pwr2_min-pwr 0.000138018 | unit1_pwr3 unit1/pwr3/pwr_11-46-30.559536.txt | unit1_pwr3_best-beam 34 | unit1_pwr3_max-pwr 0.404067338 | unit1_pwr3_min-pwr 0.00044006 | unit1_pwr4 unit1/pwr4/pwr_11-46-30.559536.txt | unit1_pwr4_best-beam 61 | unit1_pwr4_max-pwr 0.000184658 | unit1_pwr4_min-pwr 0.000119566 | unit1_radar1 unit1/radar1/data_9354_11-46-32.532000.mat | unit1_radar2 unit1/radar2/data_9273_11-46-32.488000.mat | unit1_radar3 unit1/radar3/data_9187_11-46-32.499000.mat | unit1_radar4 unit1/radar4/data_9102_11-46-32.512000.mat | unit1_lidar1 unit1/lidar1/lidar_frame_11-46-32.474528.csv | unit2_gps1 unit2/gps1/gps_33301_11-46-31.250000.txt | unit2_gps1_lat 33.42163314 | unit2_gps1_lon -111.9301749 | unit2_gps1_altitude 356.394 | unit2_gps1_hdop 0.47 | unit2_gps1_pdop 0.97 | unit2_gps1_vdop 0.85 | satellite_img resources/satellite_images/[33.42166934,-111.93017314]_20.png | unit1_pwr1_best-beam_v2 14 | unit1_pwr1_max-pwr_v2 0.00035276 | unit1_pwr1_min-pwr_v2 0.000127547 | unit1_pwr2_best-beam_v2 43 | unit1_pwr2_max-pwr_v2 0.000467878 | unit1_pwr2_min-pwr_v2 0.000138018 | unit1_pwr3_best-beam_v2 34 | unit1_pwr3_max-pwr_v2 0.404067338 | unit1_pwr3_min-pwr_v2 0.00044006 | unit1_pwr4_best-beam_v2 61 | unit1_pwr4_max-pwr_v2 0.000184658 | unit1_pwr4_min-pwr_v2 0.000119566 | unit1_overall-beam 162 |
| abs_index 2675 | timestamp 11-46-31.314452 | seq_index 1 | unit1_gps1 unit1/gps1/gps_8870_11-46-31.300000.txt | unit1_gps1_lat 33.42170564 | unit1_gps1_lon -111.9301714 | unit1_gps1_altitude 354.863 | unit1_gps1_hdop 0.5 | unit1_gps1_pdop 1.07 | unit1_gps1_vdop 0.94 | unit1_rgb1 unit1/rgb1/frame_11-46-31.305919.jpg | unit1_rgb2 unit1/rgb2/frame_11-46-31.305919.jpg | unit1_rgb3 unit1/rgb3/frame_11-46-31.305919.jpg | unit1_rgb4 unit1/rgb4/frame_11-46-31.305919.jpg | unit1_rgb5 unit1/rgb5/frame_11-46-31.305919.jpg | unit1_rgb6 unit1/rgb6/frame_11-46-31.305919.jpg | unit1_pwr1 unit1/pwr1/pwr_11-46-30.659452.txt | unit1_pwr1_best-beam 13 | unit1_pwr1_max-pwr 0.000349888 | unit1_pwr1_min-pwr 0.000128847 | unit1_pwr2 unit1/pwr2/pwr_11-46-30.659452.txt | unit1_pwr2_best-beam 42 | unit1_pwr2_max-pwr 0.00043427 | unit1_pwr2_min-pwr 0.000141008 | unit1_pwr3 unit1/pwr3/pwr_11-46-30.659452.txt | unit1_pwr3_best-beam 33 | unit1_pwr3_max-pwr 0.408059984 | unit1_pwr3_min-pwr 0.000475995 | unit1_pwr4 unit1/pwr4/pwr_11-46-30.659452.txt | unit1_pwr4_best-beam 39 | unit1_pwr4_max-pwr 0.000180168 | unit1_pwr4_min-pwr 0.00011854 | unit1_radar1 unit1/radar1/data_9355_11-46-32.633000.mat | unit1_radar2 unit1/radar2/data_9274_11-46-32.589000.mat | unit1_radar3 unit1/radar3/data_9188_11-46-32.599000.mat | unit1_radar4 unit1/radar4/data_9103_11-46-32.613000.mat | unit1_lidar1 unit1/lidar1/lidar_frame_11-46-32.574603.csv | unit2_gps1 unit2/gps1/gps_33302_11-46-31.333333.txt | unit2_gps1_lat 33.42163314 | unit2_gps1_lon -111.9301749 | unit2_gps1_altitude 356.3953333 | unit2_gps1_hdop 0.47 | unit2_gps1_pdop 0.97 | unit2_gps1_vdop 0.85 | satellite_img resources/satellite_images/[33.42166934,-111.93017314]_20.png | unit1_pwr1_best-beam_v2 13 | unit1_pwr1_max-pwr_v2 0.000349888 | unit1_pwr1_min-pwr_v2 0.000128847 | unit1_pwr2_best-beam_v2 42 | unit1_pwr2_max-pwr_v2 0.00043427 | unit1_pwr2_min-pwr_v2 0.000141008 | unit1_pwr3_best-beam_v2 33 | unit1_pwr3_max-pwr_v2 0.408059984 | unit1_pwr3_min-pwr_v2 0.000475995 | unit1_pwr4_best-beam_v2 39 | unit1_pwr4_max-pwr_v2 0.000180168 | unit1_pwr4_min-pwr_v2 0.00011854 | unit1_overall-beam 161 |
| abs_index 2676 | timestamp 11-46-31.414397 | seq_index 1 | unit1_gps1 unit1/gps1/gps_8871_11-46-31.400000.txt | unit1_gps1_lat 33.42170565 | unit1_gps1_lon -111.9301714 | unit1_gps1_altitude 354.863 | unit1_gps1_hdop 0.5 | unit1_gps1_pdop 1.07 | unit1_gps1_vdop 0.94 | unit1_rgb1 unit1/rgb1/frame_11-46-31.406020.jpg | unit1_rgb2 unit1/rgb2/frame_11-46-31.406020.jpg | unit1_rgb3 unit1/rgb3/frame_11-46-31.406020.jpg | unit1_rgb4 unit1/rgb4/frame_11-46-31.406020.jpg | unit1_rgb5 unit1/rgb5/frame_11-46-31.406020.jpg | unit1_rgb6 unit1/rgb6/frame_11-46-31.406020.jpg | unit1_pwr1 unit1/pwr1/pwr_11-46-30.759397.txt | unit1_pwr1_best-beam 15 | unit1_pwr1_max-pwr 0.000324646 | unit1_pwr1_min-pwr 0.000129534 | unit1_pwr2 unit1/pwr2/pwr_11-46-30.759397.txt | unit1_pwr2_best-beam 43 | unit1_pwr2_max-pwr 0.000489776 | unit1_pwr2_min-pwr 0.000135558 | unit1_pwr3 unit1/pwr3/pwr_11-46-30.759397.txt | unit1_pwr3_best-beam 34 | unit1_pwr3_max-pwr 0.404244065 | unit1_pwr3_min-pwr 0.000491512 | unit1_pwr4 unit1/pwr4/pwr_11-46-30.759397.txt | unit1_pwr4_best-beam 1 | unit1_pwr4_max-pwr 0.000167104 | unit1_pwr4_min-pwr 0.000112127 | unit1_radar1 unit1/radar1/data_9356_11-46-32.733000.mat | unit1_radar2 unit1/radar2/data_9275_11-46-32.689000.mat | unit1_radar3 unit1/radar3/data_9189_11-46-32.700000.mat | unit1_radar4 unit1/radar4/data_9104_11-46-32.712000.mat | unit1_lidar1 unit1/lidar1/lidar_frame_11-46-32.674663.csv | unit2_gps1 unit2/gps1/gps_33303_11-46-31.416666.txt | unit2_gps1_lat 33.42163314 | unit2_gps1_lon -111.9301749 | unit2_gps1_altitude 356.3966667 | unit2_gps1_hdop 0.47 | unit2_gps1_pdop 0.97 | unit2_gps1_vdop 0.85 | satellite_img resources/satellite_images/[33.42166934,-111.93017314]_20.png | unit1_pwr1_best-beam_v2 15 | unit1_pwr1_max-pwr_v2 0.000324646 | unit1_pwr1_min-pwr_v2 0.000129534 | unit1_pwr2_best-beam_v2 43 | unit1_pwr2_max-pwr_v2 0.000489776 | unit1_pwr2_min-pwr_v2 0.000135558 | unit1_pwr3_best-beam_v2 34 | unit1_pwr3_max-pwr_v2 0.404244065 | unit1_pwr3_min-pwr_v2 0.000491512 | unit1_pwr4_best-beam_v2 1 | unit1_pwr4_max-pwr_v2 0.000167104 | unit1_pwr4_min-pwr_v2 0.000112127 | unit1_overall-beam 162 |
| abs_index 2677 | timestamp 11-46-31.514787 | seq_index 1 | unit1_gps1 unit1/gps1/gps_8872_11-46-31.500000.txt | unit1_gps1_lat 33.42170565 | unit1_gps1_lon -111.9301714 | unit1_gps1_altitude 354.858 | unit1_gps1_hdop 0.5 | unit1_gps1_pdop 1.07 | unit1_gps1_vdop 0.94 | unit1_rgb1 unit1/rgb1/frame_11-46-31.506121.jpg | unit1_rgb2 unit1/rgb2/frame_11-46-31.506121.jpg | unit1_rgb3 unit1/rgb3/frame_11-46-31.506121.jpg | unit1_rgb4 unit1/rgb4/frame_11-46-31.506121.jpg | unit1_rgb5 unit1/rgb5/frame_11-46-31.506121.jpg | unit1_rgb6 unit1/rgb6/frame_11-46-31.506121.jpg | unit1_pwr1 unit1/pwr1/pwr_11-46-30.859787.txt | unit1_pwr1_best-beam 11 | unit1_pwr1_max-pwr 0.000413088 | unit1_pwr1_min-pwr 0.000130448 | unit1_pwr2 unit1/pwr2/pwr_11-46-30.859787.txt | unit1_pwr2_best-beam 43 | unit1_pwr2_max-pwr 0.000478923 | unit1_pwr2_min-pwr 0.000140596 | unit1_pwr3 unit1/pwr3/pwr_11-46-30.859787.txt | unit1_pwr3_best-beam 34 | unit1_pwr3_max-pwr 0.390380949 | unit1_pwr3_min-pwr 0.000527667 | unit1_pwr4 unit1/pwr4/pwr_11-46-30.859787.txt | unit1_pwr4_best-beam 1 | unit1_pwr4_max-pwr 0.000172153 | unit1_pwr4_min-pwr 0.000115591 | unit1_radar1 unit1/radar1/data_9357_11-46-32.832000.mat | unit1_radar2 unit1/radar2/data_9276_11-46-32.789000.mat | unit1_radar3 unit1/radar3/data_9190_11-46-32.800000.mat | unit1_radar4 unit1/radar4/data_9105_11-46-32.813000.mat | unit1_lidar1 unit1/lidar1/lidar_frame_11-46-32.774699.csv | unit2_gps1 unit2/gps1/gps_33304_11-46-31.500000.txt | unit2_gps1_lat 33.42163314 | unit2_gps1_lon -111.9301749 | unit2_gps1_altitude 356.398 | unit2_gps1_hdop 0.47 | unit2_gps1_pdop 0.97 | unit2_gps1_vdop 0.85 | satellite_img resources/satellite_images/[33.42166934,-111.93017314]_20.png | unit1_pwr1_best-beam_v2 11 | unit1_pwr1_max-pwr_v2 0.000413088 | unit1_pwr1_min-pwr_v2 0.000130448 | unit1_pwr2_best-beam_v2 43 | unit1_pwr2_max-pwr_v2 0.000478923 | unit1_pwr2_min-pwr_v2 0.000140596 | unit1_pwr3_best-beam_v2 34 | unit1_pwr3_max-pwr_v2 0.390380949 | unit1_pwr3_min-pwr_v2 0.000527667 | unit1_pwr4_best-beam_v2 1 | unit1_pwr4_max-pwr_v2 0.000172153 | unit1_pwr4_min-pwr_v2 0.000115591 | unit1_overall-beam 162 |
| abs_index 2678 | timestamp 11-46-31.615223 | seq_index 1 | unit1_gps1 unit1/gps1/gps_8873_11-46-31.600000.txt | unit1_gps1_lat 33.42170565 | unit1_gps1_lon -111.9301714 | unit1_gps1_altitude 354.851 | unit1_gps1_hdop 0.5 | unit1_gps1_pdop 1.07 | unit1_gps1_vdop 0.94 | unit1_rgb1 unit1/rgb1/frame_11-46-31.606222.jpg | unit1_rgb2 unit1/rgb2/frame_11-46-31.606222.jpg | unit1_rgb3 unit1/rgb3/frame_11-46-31.606222.jpg | unit1_rgb4 unit1/rgb4/frame_11-46-31.606222.jpg | unit1_rgb5 unit1/rgb5/frame_11-46-31.606222.jpg | unit1_rgb6 unit1/rgb6/frame_11-46-31.606222.jpg | unit1_pwr1 unit1/pwr1/pwr_11-46-30.960223.txt | unit1_pwr1_best-beam 12 | unit1_pwr1_max-pwr 0.000508741 | unit1_pwr1_min-pwr 0.000123409 | unit1_pwr2 unit1/pwr2/pwr_11-46-30.960223.txt | unit1_pwr2_best-beam 43 | unit1_pwr2_max-pwr 0.000450344 | unit1_pwr2_min-pwr 0.000134008 | unit1_pwr3 unit1/pwr3/pwr_11-46-30.960223.txt | unit1_pwr3_best-beam 33 | unit1_pwr3_max-pwr 0.403402328 | unit1_pwr3_min-pwr 0.000502282 | unit1_pwr4 unit1/pwr4/pwr_11-46-30.960223.txt | unit1_pwr4_best-beam 1 | unit1_pwr4_max-pwr 0.000173931 | unit1_pwr4_min-pwr 0.000123042 | unit1_radar1 unit1/radar1/data_9358_11-46-32.932000.mat | unit1_radar2 unit1/radar2/data_9277_11-46-32.888000.mat | unit1_radar3 unit1/radar3/data_9191_11-46-32.899000.mat | unit1_radar4 unit1/radar4/data_9106_11-46-32.912000.mat | unit1_lidar1 unit1/lidar1/lidar_frame_11-46-32.874705.csv | unit2_gps1 unit2/gps1/gps_33305_11-46-31.583333.txt | unit2_gps1_lat 33.42163313 | unit2_gps1_lon -111.9301749 | unit2_gps1_altitude 356.4026667 | unit2_gps1_hdop 0.47 | unit2_gps1_pdop 0.97 | unit2_gps1_vdop 0.85 | satellite_img resources/satellite_images/[33.42166934,-111.93017314]_20.png | unit1_pwr1_best-beam_v2 12 | unit1_pwr1_max-pwr_v2 0.000508741 | unit1_pwr1_min-pwr_v2 0.000123409 | unit1_pwr2_best-beam_v2 43 | unit1_pwr2_max-pwr_v2 0.000450344 | unit1_pwr2_min-pwr_v2 0.000134008 | unit1_pwr3_best-beam_v2 33 | unit1_pwr3_max-pwr_v2 0.403402328 | unit1_pwr3_min-pwr_v2 0.000502282 | unit1_pwr4_best-beam_v2 1 | unit1_pwr4_max-pwr_v2 0.000173931 | unit1_pwr4_min-pwr_v2 0.000123042 | unit1_overall-beam 161 |
| abs_index 2679 | timestamp 11-46-31.714998 | seq_index 1 | unit1_gps1 unit1/gps1/gps_8874_11-46-31.700000.txt | unit1_gps1_lat 33.42170565 | unit1_gps1_lon -111.9301714 | unit1_gps1_altitude 354.854 | unit1_gps1_hdop 0.5 | unit1_gps1_pdop 1.07 | unit1_gps1_vdop 0.94 | unit1_rgb1 unit1/rgb1/frame_11-46-31.706323.jpg | unit1_rgb2 unit1/rgb2/frame_11-46-31.706323.jpg | unit1_rgb3 unit1/rgb3/frame_11-46-31.706323.jpg | unit1_rgb4 unit1/rgb4/frame_11-46-31.706323.jpg | unit1_rgb5 unit1/rgb5/frame_11-46-31.706323.jpg | unit1_rgb6 unit1/rgb6/frame_11-46-31.706323.jpg | unit1_pwr1 unit1/pwr1/pwr_11-46-31.059998.txt | unit1_pwr1_best-beam 10 | unit1_pwr1_max-pwr 0.000306441 | unit1_pwr1_min-pwr 0.000122838 | unit1_pwr2 unit1/pwr2/pwr_11-46-31.059998.txt | unit1_pwr2_best-beam 51 | unit1_pwr2_max-pwr 0.000414832 | unit1_pwr2_min-pwr 0.000136546 | unit1_pwr3 unit1/pwr3/pwr_11-46-31.059998.txt | unit1_pwr3_best-beam 33 | unit1_pwr3_max-pwr 0.410841346 | unit1_pwr3_min-pwr 0.000444343 | unit1_pwr4 unit1/pwr4/pwr_11-46-31.059998.txt | unit1_pwr4_best-beam 1 | unit1_pwr4_max-pwr 0.000171001 | unit1_pwr4_min-pwr 0.000121829 | unit1_radar1 unit1/radar1/data_9359_11-46-33.032000.mat | unit1_radar2 unit1/radar2/data_9278_11-46-32.988000.mat | unit1_radar3 unit1/radar3/data_9192_11-46-32.998000.mat | unit1_radar4 unit1/radar4/data_9107_11-46-33.012000.mat | unit1_lidar1 unit1/lidar1/lidar_frame_11-46-32.974673.csv | unit2_gps1 unit2/gps1/gps_33307_11-46-31.750000.txt | unit2_gps1_lat 33.42163312 | unit2_gps1_lon -111.9301749 | unit2_gps1_altitude 356.412 | unit2_gps1_hdop 0.47 | unit2_gps1_pdop 0.97 | unit2_gps1_vdop 0.85 | satellite_img resources/satellite_images/[33.42166934,-111.93017314]_20.png | unit1_pwr1_best-beam_v2 10 | unit1_pwr1_max-pwr_v2 0.000306441 | unit1_pwr1_min-pwr_v2 0.000122838 | unit1_pwr2_best-beam_v2 51 | unit1_pwr2_max-pwr_v2 0.000414832 | unit1_pwr2_min-pwr_v2 0.000136546 | unit1_pwr3_best-beam_v2 33 | unit1_pwr3_max-pwr_v2 0.410841346 | unit1_pwr3_min-pwr_v2 0.000444343 | unit1_pwr4_best-beam_v2 1 | unit1_pwr4_max-pwr_v2 0.000171001 | unit1_pwr4_min-pwr_v2 0.000121829 | unit1_overall-beam 161 |
| abs_index 2680 | timestamp 11-46-31.814664 | seq_index 1 | unit1_gps1 unit1/gps1/gps_8875_11-46-31.800000.txt | unit1_gps1_lat 33.42170565 | unit1_gps1_lon -111.9301714 | unit1_gps1_altitude 354.853 | unit1_gps1_hdop 0.5 | unit1_gps1_pdop 1.07 | unit1_gps1_vdop 0.94 | unit1_rgb1 unit1/rgb1/frame_11-46-31.806424.jpg | unit1_rgb2 unit1/rgb2/frame_11-46-31.806424.jpg | unit1_rgb3 unit1/rgb3/frame_11-46-31.806424.jpg | unit1_rgb4 unit1/rgb4/frame_11-46-31.806424.jpg | unit1_rgb5 unit1/rgb5/frame_11-46-31.806424.jpg | unit1_rgb6 unit1/rgb6/frame_11-46-31.806424.jpg | unit1_pwr1 unit1/pwr1/pwr_11-46-31.159664.txt | unit1_pwr1_best-beam 13 | unit1_pwr1_max-pwr 0.000301362 | unit1_pwr1_min-pwr 0.000126002 | unit1_pwr2 unit1/pwr2/pwr_11-46-31.159664.txt | unit1_pwr2_best-beam 43 | unit1_pwr2_max-pwr 0.000424942 | unit1_pwr2_min-pwr 0.000141353 | unit1_pwr3 unit1/pwr3/pwr_11-46-31.159664.txt | unit1_pwr3_best-beam 34 | unit1_pwr3_max-pwr 0.391413182 | unit1_pwr3_min-pwr 0.000476408 | unit1_pwr4 unit1/pwr4/pwr_11-46-31.159664.txt | unit1_pwr4_best-beam 1 | unit1_pwr4_max-pwr 0.000185649 | unit1_pwr4_min-pwr 0.000117182 | unit1_radar1 unit1/radar1/data_9360_11-46-33.133000.mat | unit1_radar2 unit1/radar2/data_9279_11-46-33.088000.mat | unit1_radar3 unit1/radar3/data_9193_11-46-33.099000.mat | unit1_radar4 unit1/radar4/data_9108_11-46-33.112000.mat | unit1_lidar1 unit1/lidar1/lidar_frame_11-46-33.074633.csv | unit2_gps1 unit2/gps1/gps_33308_11-46-31.833333.txt | unit2_gps1_lat 33.42163312 | unit2_gps1_lon -111.9301749 | unit2_gps1_altitude 356.417 | unit2_gps1_hdop 0.47 | unit2_gps1_pdop 0.97 | unit2_gps1_vdop 0.85 | satellite_img resources/satellite_images/[33.42166934,-111.93017314]_20.png | unit1_pwr1_best-beam_v2 13 | unit1_pwr1_max-pwr_v2 0.000301362 | unit1_pwr1_min-pwr_v2 0.000126002 | unit1_pwr2_best-beam_v2 43 | unit1_pwr2_max-pwr_v2 0.000424942 | unit1_pwr2_min-pwr_v2 0.000141353 | unit1_pwr3_best-beam_v2 34 | unit1_pwr3_max-pwr_v2 0.391413182 | unit1_pwr3_min-pwr_v2 0.000476408 | unit1_pwr4_best-beam_v2 1 | unit1_pwr4_max-pwr_v2 0.000185649 | unit1_pwr4_min-pwr_v2 0.000117182 | unit1_overall-beam 162 |
| abs_index 2681 | timestamp 11-46-31.914686 | seq_index 1 | unit1_gps1 unit1/gps1/gps_8876_11-46-31.900000.txt | unit1_gps1_lat 33.42170566 | unit1_gps1_lon -111.9301715 | unit1_gps1_altitude 354.851 | unit1_gps1_hdop 0.5 | unit1_gps1_pdop 1.07 | unit1_gps1_vdop 0.94 | unit1_rgb1 unit1/rgb1/frame_11-46-31.906525.jpg | unit1_rgb2 unit1/rgb2/frame_11-46-31.906525.jpg | unit1_rgb3 unit1/rgb3/frame_11-46-31.906525.jpg | unit1_rgb4 unit1/rgb4/frame_11-46-31.906525.jpg | unit1_rgb5 unit1/rgb5/frame_11-46-31.906525.jpg | unit1_rgb6 unit1/rgb6/frame_11-46-31.906525.jpg | unit1_pwr1 unit1/pwr1/pwr_11-46-31.259686.txt | unit1_pwr1_best-beam 11 | unit1_pwr1_max-pwr 0.000321 | unit1_pwr1_min-pwr 0.000134091 | unit1_pwr2 unit1/pwr2/pwr_11-46-31.259686.txt | unit1_pwr2_best-beam 52 | unit1_pwr2_max-pwr 0.000365033 | unit1_pwr2_min-pwr 0.000140903 | unit1_pwr3 unit1/pwr3/pwr_11-46-31.259686.txt | unit1_pwr3_best-beam 33 | unit1_pwr3_max-pwr 0.395959586 | unit1_pwr3_min-pwr 0.000455432 | unit1_pwr4 unit1/pwr4/pwr_11-46-31.259686.txt | unit1_pwr4_best-beam 2 | unit1_pwr4_max-pwr 0.000170487 | unit1_pwr4_min-pwr 0.000122219 | unit1_radar1 unit1/radar1/data_9361_11-46-33.233000.mat | unit1_radar2 unit1/radar2/data_9280_11-46-33.189000.mat | unit1_radar3 unit1/radar3/data_9194_11-46-33.198000.mat | unit1_radar4 unit1/radar4/data_9109_11-46-33.212000.mat | unit1_lidar1 unit1/lidar1/lidar_frame_11-46-33.174575.csv | unit2_gps1 unit2/gps1/gps_33309_11-46-31.916666.txt | unit2_gps1_lat 33.42163311 | unit2_gps1_lon -111.9301749 | unit2_gps1_altitude 356.422 | unit2_gps1_hdop 0.47 | unit2_gps1_pdop 0.97 | unit2_gps1_vdop 0.85 | satellite_img resources/satellite_images/[33.42166934,-111.93017314]_20.png | unit1_pwr1_best-beam_v2 11 | unit1_pwr1_max-pwr_v2 0.000321 | unit1_pwr1_min-pwr_v2 0.000134091 | unit1_pwr2_best-beam_v2 52 | unit1_pwr2_max-pwr_v2 0.000365033 | unit1_pwr2_min-pwr_v2 0.000140903 | unit1_pwr3_best-beam_v2 33 | unit1_pwr3_max-pwr_v2 0.395959586 | unit1_pwr3_min-pwr_v2 0.000455432 | unit1_pwr4_best-beam_v2 2 | unit1_pwr4_max-pwr_v2 0.000170487 | unit1_pwr4_min-pwr_v2 0.000122219 | unit1_overall-beam 161 |
| abs_index 2682 | timestamp 11-46-32.015005 | seq_index 1 | unit1_gps1 unit1/gps1/gps_8877_11-46-32.000000.txt | unit1_gps1_lat 33.42170568 | unit1_gps1_lon -111.9301714 | unit1_gps1_altitude 354.844 | unit1_gps1_hdop 0.5 | unit1_gps1_pdop 1.07 | unit1_gps1_vdop 0.94 | unit1_rgb1 unit1/rgb1/frame_11-46-32.006626.jpg | unit1_rgb2 unit1/rgb2/frame_11-46-32.006626.jpg | unit1_rgb3 unit1/rgb3/frame_11-46-32.006626.jpg | unit1_rgb4 unit1/rgb4/frame_11-46-32.006626.jpg | unit1_rgb5 unit1/rgb5/frame_11-46-32.006626.jpg | unit1_rgb6 unit1/rgb6/frame_11-46-32.006626.jpg | unit1_pwr1 unit1/pwr1/pwr_11-46-31.360005.txt | unit1_pwr1_best-beam 12 | unit1_pwr1_max-pwr 0.000398708 | unit1_pwr1_min-pwr 0.000135084 | unit1_pwr2 unit1/pwr2/pwr_11-46-31.360005.txt | unit1_pwr2_best-beam 43 | unit1_pwr2_max-pwr 0.000386491 | unit1_pwr2_min-pwr 0.000140892 | unit1_pwr3 unit1/pwr3/pwr_11-46-31.360005.txt | unit1_pwr3_best-beam 34 | unit1_pwr3_max-pwr 0.393165201 | unit1_pwr3_min-pwr 0.000530763 | unit1_pwr4 unit1/pwr4/pwr_11-46-31.360005.txt | unit1_pwr4_best-beam 1 | unit1_pwr4_max-pwr 0.000175626 | unit1_pwr4_min-pwr 0.000119581 | unit1_radar1 unit1/radar1/data_9362_11-46-33.332000.mat | unit1_radar2 unit1/radar2/data_9281_11-46-33.289000.mat | unit1_radar3 unit1/radar3/data_9195_11-46-33.299000.mat | unit1_radar4 unit1/radar4/data_9110_11-46-33.312000.mat | unit1_lidar1 unit1/lidar1/lidar_frame_11-46-33.274552.csv | unit2_gps1 unit2/gps1/gps_33310_11-46-32.000000.txt | unit2_gps1_lat 33.42163311 | unit2_gps1_lon -111.9301749 | unit2_gps1_altitude 356.427 | unit2_gps1_hdop 0.47 | unit2_gps1_pdop 0.97 | unit2_gps1_vdop 0.85 | satellite_img resources/satellite_images/[33.42166934,-111.93017314]_20.png | unit1_pwr1_best-beam_v2 12 | unit1_pwr1_max-pwr_v2 0.000398708 | unit1_pwr1_min-pwr_v2 0.000135084 | unit1_pwr2_best-beam_v2 43 | unit1_pwr2_max-pwr_v2 0.000386491 | unit1_pwr2_min-pwr_v2 0.000140892 | unit1_pwr3_best-beam_v2 34 | unit1_pwr3_max-pwr_v2 0.393165201 | unit1_pwr3_min-pwr_v2 0.000530763 | unit1_pwr4_best-beam_v2 1 | unit1_pwr4_max-pwr_v2 0.000175626 | unit1_pwr4_min-pwr_v2 0.000119581 | unit1_overall-beam 162 |
| abs_index 2683 | timestamp 11-46-32.114994 | seq_index 1 | unit1_gps1 unit1/gps1/gps_8879_11-46-32.133334.txt | unit1_gps1_lat 33.42170567 | unit1_gps1_lon -111.9301714 | unit1_gps1_altitude 354.8426667 | unit1_gps1_hdop 0.5 | unit1_gps1_pdop 1.07 | unit1_gps1_vdop 0.94 | unit1_rgb1 unit1/rgb1/frame_11-46-32.106727.jpg | unit1_rgb2 unit1/rgb2/frame_11-46-32.106727.jpg | unit1_rgb3 unit1/rgb3/frame_11-46-32.106727.jpg | unit1_rgb4 unit1/rgb4/frame_11-46-32.106727.jpg | unit1_rgb5 unit1/rgb5/frame_11-46-32.106727.jpg | unit1_rgb6 unit1/rgb6/frame_11-46-32.106727.jpg | unit1_pwr1 unit1/pwr1/pwr_11-46-31.459994.txt | unit1_pwr1_best-beam 11 | unit1_pwr1_max-pwr 0.000368756 | unit1_pwr1_min-pwr 0.000117846 | unit1_pwr2 unit1/pwr2/pwr_11-46-31.459994.txt | unit1_pwr2_best-beam 42 | unit1_pwr2_max-pwr 0.000505937 | unit1_pwr2_min-pwr 0.000129929 | unit1_pwr3 unit1/pwr3/pwr_11-46-31.459994.txt | unit1_pwr3_best-beam 33 | unit1_pwr3_max-pwr 0.406335294 | unit1_pwr3_min-pwr 0.000462808 | unit1_pwr4 unit1/pwr4/pwr_11-46-31.459994.txt | unit1_pwr4_best-beam 2 | unit1_pwr4_max-pwr 0.000164664 | unit1_pwr4_min-pwr 0.000117301 | unit1_radar1 unit1/radar1/data_9363_11-46-33.433000.mat | unit1_radar2 unit1/radar2/data_9282_11-46-33.389000.mat | unit1_radar3 unit1/radar3/data_9196_11-46-33.399000.mat | unit1_radar4 unit1/radar4/data_9111_11-46-33.412000.mat | unit1_lidar1 unit1/lidar1/lidar_frame_11-46-33.374547.csv | unit2_gps1 unit2/gps1/gps_33311_11-46-32.083333.txt | unit2_gps1_lat 33.42163311 | unit2_gps1_lon -111.9301749 | unit2_gps1_altitude 356.4256667 | unit2_gps1_hdop 0.47 | unit2_gps1_pdop 0.97 | unit2_gps1_vdop 0.85 | satellite_img resources/satellite_images/[33.42166934,-111.93017314]_20.png | unit1_pwr1_best-beam_v2 11 | unit1_pwr1_max-pwr_v2 0.000368756 | unit1_pwr1_min-pwr_v2 0.000117846 | unit1_pwr2_best-beam_v2 42 | unit1_pwr2_max-pwr_v2 0.000505937 | unit1_pwr2_min-pwr_v2 0.000129929 | unit1_pwr3_best-beam_v2 33 | unit1_pwr3_max-pwr_v2 0.406335294 | unit1_pwr3_min-pwr_v2 0.000462808 | unit1_pwr4_best-beam_v2 2 | unit1_pwr4_max-pwr_v2 0.000164664 | unit1_pwr4_min-pwr_v2 0.000117301 | unit1_overall-beam 161 |
License
If you want to use the dataset or scripts in this page, please cite the following two papers:
A. Alkhateeb, G. Charan, T. Osman, A. Hredzak, J. Morais, U. Demirhan, and N. Srinivas, “DeepSense 6G: A Large-Scale Real-World Multi-Modal Sensing and Communication Datasets,” available on arXiv, 2022. [Online]. Available: https://www.DeepSense6G.net
@Article{DeepSense,
author={Alkhateeb, Ahmed and Charan, Gouranga and Osman, Tawfik and Hredzak, Andrew and Morais, Joao and Demirhan, Umut and Srinivas, Nikhil},
title={DeepSense 6G: A Large-Scale Real-World Multi-Modal Sensing and Communication Dataset},
journal={IEEE Communications Magazine},
year={2023},
publisher={IEEE},}
J. Morais, G. Charan, N. Srinivas, and A. Alkhateeb, “DeepSense-V2V: A Vehicle-to-Vehicle Multi-Modal Sensing, Localization, and Communications Dataset,” available on arXiv, 2024. [Online]
@misc{DeepSenseV2V,
title={DeepSense-V2V: A Vehicle-to-Vehicle Multi-Modal Sensing, Localization, and Communications Dataset},
author={Joao Morais and Gouranga Charan and Nikhil Srinivas and Ahmed Alkhateeb},
year={2024},
eprint={2406.17908},
archivePrefix={arXiv},
primaryClass={eess.SP},
url={https://arxiv.org/abs/2406.17908},
}