
Scenario 16
License

If you want to use the dataset or scripts on this page, please use the link below to generate the final list of papers that need to be cited.
Overview
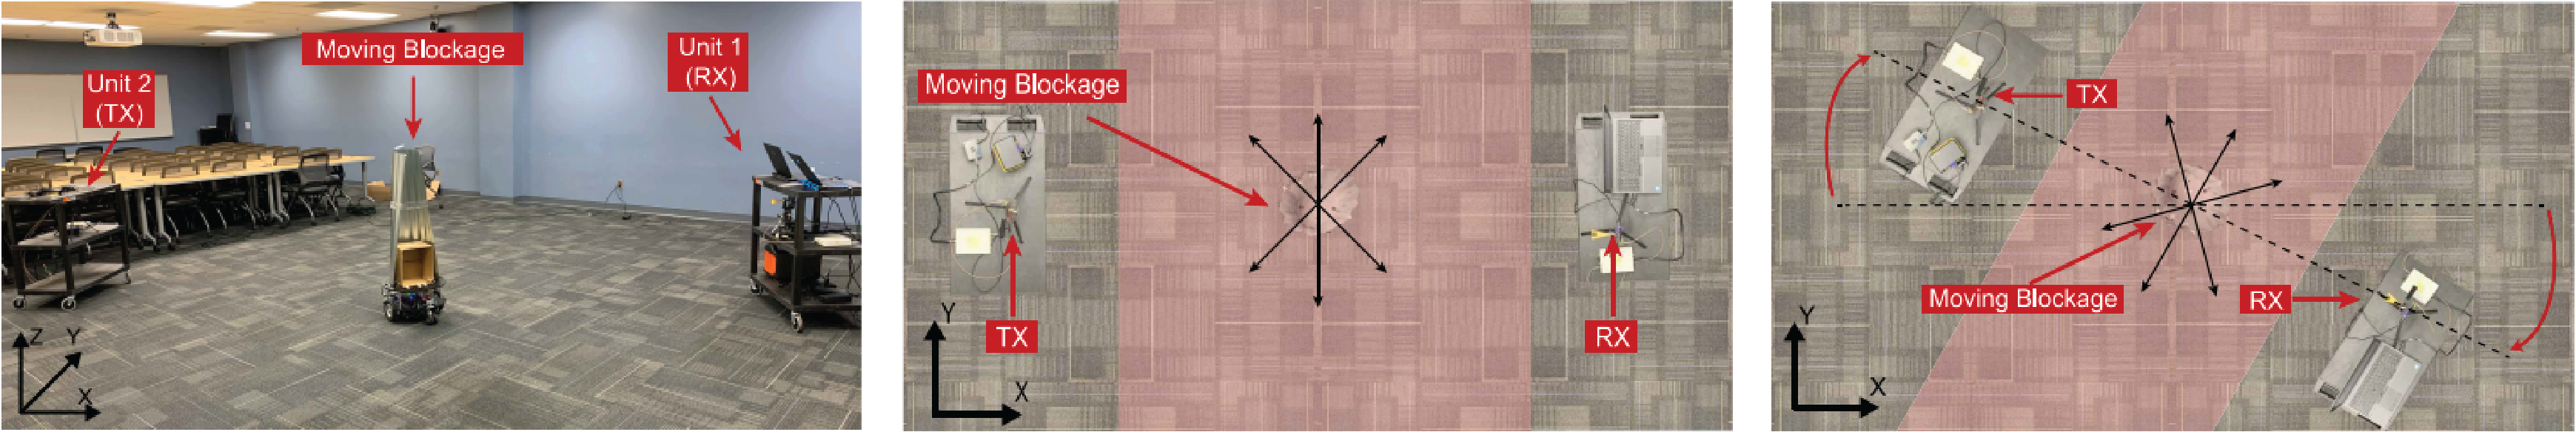
Scenarios 16 is designed to study indoor blockages. It has two stationary units, namely Unit 1 and Unit 2, as shown in Fig. 5. Unit 1 hosts a 60 GHz mmWave receiver equipped with a 10-degree beamwidth (20 dBi) horn antenna and an RGB camera, while Unit 2 hosts a 60 GHz mmWave transmitter with an omni-directional antenna. The 60 GHz transmitter and receiver are controlled by two laptops and the transmit/receive signals from the laptops and the transmitter/receiver pass through two 2901 NI USRPs. The two units coordinate the data collection using an IEEE 802.11-based control/communication channel. The transmit/receive waveform adopts an OFDM structure with 20MHz bandwidth and 64 subcarriers. The total transmit power from Unit 2 is limited to 30 dBm. Please refer to the detailed description of the testbed presented here.
Conference Room Moving Blockage: This is an indoor scenario where the DeepSense Testbed 2 and a moving metal blockage in the shape of a cylinder are deployed in a large conference room, as depicted in Fig. 5. The transmitter and receiver are placed facing each other (have LOS connection) with a separating distance of ≈ 8 m between them. The blockage moves back and forth between the transmitter and receiver in two straight trajectories spaced 1 m apart and at a speed of 0.0625 m/s. In order to get different signal propagation conditions and increase the variance in the collected measurements, the testbed is rotated around the center of the blockage path on the x-y plane as shown in Fig. 6, and the blockage is set to move again between the TX and RX in two trajectories with the same 1 m spacing. The testbed collects data samples at a rate of 1.13 samples/s. Each data sample contains (i) an RGB image and (ii) the receive power value, both collected from Unit 1.
Collected Data
Overview
Number of Data Collection Units: 1 (using DeepSense Testbed #2)
Number of Data Samples: 9827
Data Modalities: RGB images, 64-dimensional received power vector
Sensors at Unit 1: (Stationary Receiver)
- Wireless Sensor [Phased Array]: A 16-element antenna array operating in the 60 GHz frequency band and receives the transmitted signal using an over-sampled codebook of 64 pre-defined beams
- Visual Sensor [Camera]: The main visual perception element in the testbed is an RGB-D camera. The camera is used to capture RGB images of 960×540 resolution at a base frame rate of 30 frames per second (fps)
| Testbed | 2 |
|---|---|
| Instances | 9827 |
| Number of Units | 2 |
| Total Data Modalities | RGB images, 64-dimensional received power vector |
| Unit1 | |
| Type | Stationary |
| Hardware Elements | RGB camera, mmWave phased array receiver |
| Data Modalities | RGB images, 64-dimensional received power vector |
| Unit2 | |
| Type | Mobile |
| Hardware Elements | mmWave omni-directional transmitter |
| Data Modalities | None |
Data Visualization
Download
Please login to download the DeepSense datasets
How to Access Scenario 16 Data?
Step 1. Download Scenario Data
Step 2. Extract the scenario16.zip file
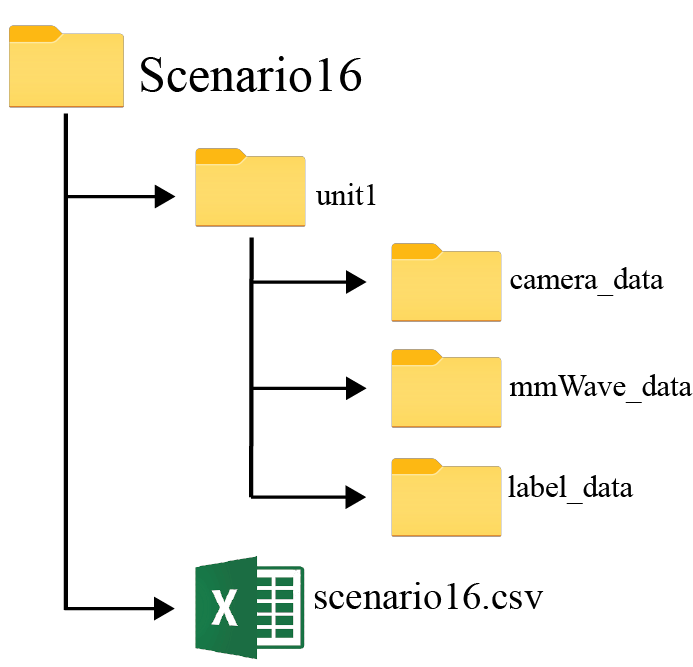
Scenario X folder consists of two sub-folders:
- unit1: Includes the data captured by unit 1
Scenario 16 folder also includes the “scenario16.csv” file with the paths to all the collected data. For each coherent time, we provide the corresponding visual and wireless data
Resources
What are the Additional Resources?
Resources consist of the following information:
- data labels: The labels comprises of the ground-truth link blockage status, where ‘0’ represent line-of-sight (LOS) connection and ‘1’ represent blocked connection
Warning on NaN values: Some samples (<1%) in the column ‘unit1_pwr_60ghz’ contain NaNs (not-a-value). These NaNs result from random, real-world sensor errors. In the context of received power, NaNs can be considered as zeros. Assuming that pwr_vect is our received power vector, one can explicitly convert the NaNs into zeros by doing pwr_vect(isnan(pwr_vect)) = 0 in Matlab or pwr_vect[np.isnan(pwr_vect)] = 0 in Python.
Data Labels
The label comprises of the ground-truth link-status manually annotated from the RGB images
- Ground-Truth Blockage: We utilize the RGB images and manually annotate the data samples with link-status labels. More specifically, a link-status label of ‘1’ is assigned to a time instance when the LOS link is blocked and a label of ‘0’ otherwise.
An example table is shown below.
| index | unit1_rgb | unit1_pwr_60ghz | unit1_blockage | seq_index |
|---|---|---|---|---|
| 1 | ./unit1/camera_data/image1.jpg | ./unit1/mmWave_data/mmWave_power_1.txt | ./unit1/label_data/label_1.txt | 1 |
| 2 | ./unit1/camera_data/image2.jpg | ./unit1/mmWave_data/mmWave_power_2.txt | ./unit1/label_data/label_2.txt | 1 |
| 3 | ./unit1/camera_data/image3.jpg | ./unit1/mmWave_data/mmWave_power_3.txt | ./unit1/label_data/label_3.txt | 1 |
| 4 | ./unit1/camera_data/image4.jpg | ./unit1/mmWave_data/mmWave_power_4.txt | ./unit1/label_data/label_4.txt | 1 |
| 5 | ./unit1/camera_data/image5.jpg | ./unit1/mmWave_data/mmWave_power_5.txt | ./unit1/label_data/label_5.txt | 1 |
| 6 | ./unit1/camera_data/image6.jpg | ./unit1/mmWave_data/mmWave_power_6.txt | ./unit1/label_data/label_6.txt | 1 |
| 7 | ./unit1/camera_data/image7.jpg | ./unit1/mmWave_data/mmWave_power_7.txt | ./unit1/label_data/label_7.txt | 1 |
| 8 | ./unit1/camera_data/image8.jpg | ./unit1/mmWave_data/mmWave_power_8.txt | ./unit1/label_data/label_8.txt | 1 |
| 9 | ./unit1/camera_data/image9.jpg | ./unit1/mmWave_data/mmWave_power_9.txt | ./unit1/label_data/label_9.txt | 1 |
| 10 | ./unit1/camera_data/image10.jpg | ./unit1/mmWave_data/mmWave_power_10.txt | ./unit1/label_data/label_10.txt | 1 |